Project Overview
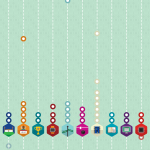
At the 2015 Grace Hopper Conference, Qualcomm hosted a special event showcasing connectivity and data processing. As a way of making this big data fun and interactive for the guests, our team was tasked with designing a way of displaying the data. Participants were given an device “badge” that they used to interact with one another, sharing data, and sending it through the cloud. The data was aggregated and the results were shown on the display.
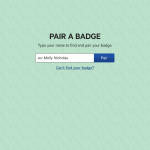
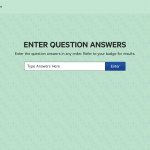
The badges were also used later for a trivia game that was played by participants at the event. Users would team up and pair one person’s badge with a computer. Participants were given a list of trivia questions, which they would answer on the computer. Data was sent through the cloud, processed, and results were displayed on the badges.
Contributions & Process
Worked closely with the Engineering and UX teams to determine the target audience and personas of participants, understand the data flow of the different technologies involved, observe and provide feedback during initial testing prior to the event, and provide feedback to Engineering on the implementation.
Write a set of 18 yes/no questions that would apply to the participants in the target group.
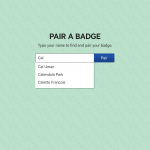
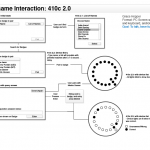
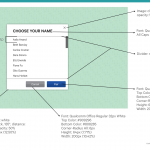
Interaction, user flow, and visual design for the Game UI including: homepage, device pairing, and answer entry pages.
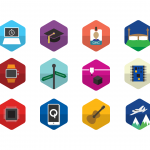
Visual design for the social display, including iconography design and animation/motion.
Social Display & Game UI
